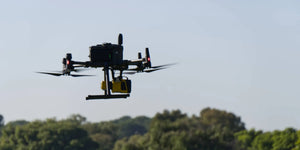
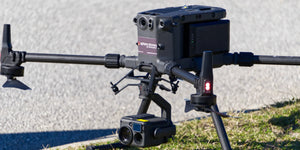
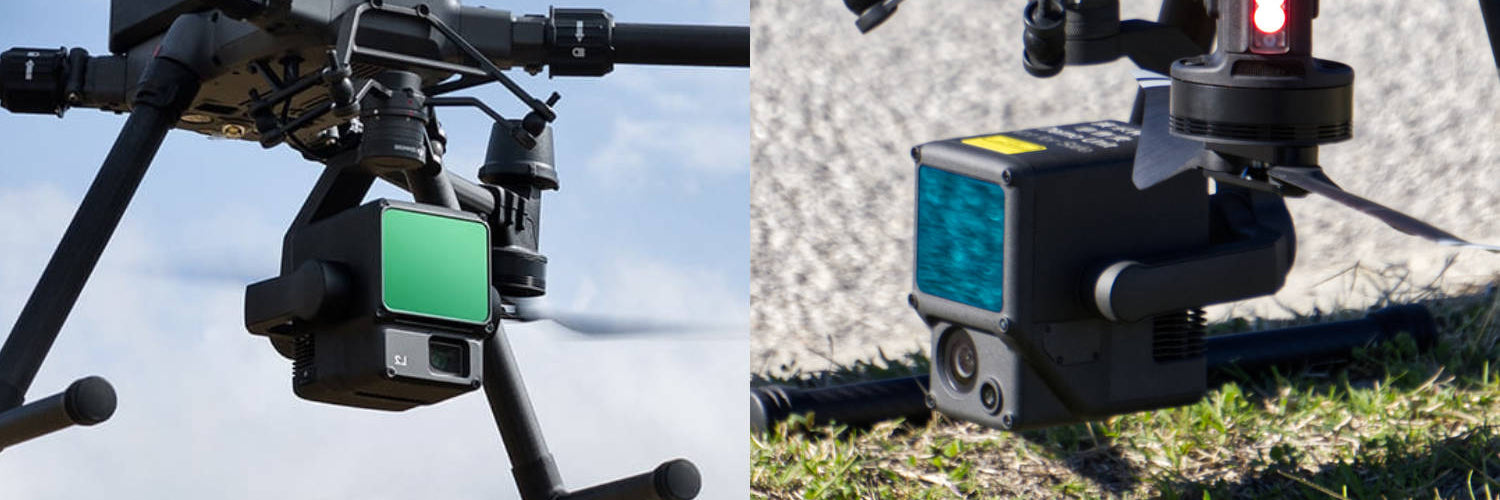
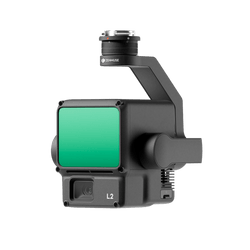
Our team got hands on with the new DJI Zenmuse L2 payload to put its through its paces and see how it compares with the Zenmuse L1.
DJI's new Zenmuse L2 is more accurate and precise, can be flown at a higher rate of speed, and no longer requires an IMU warm-up period. Let's see what these changes mean for the L2 compared to the L1.
Testing location
The testing location was an agricultural property in NSW, Australia. It was chosen based on the creek covered by a dense tree canopy running through the centre.
Using this location with this specific environment allowed our team to put the upgrades DJI added to the L2 to work and see if they improve it's ability to better penetrate vegetation.
Workflow
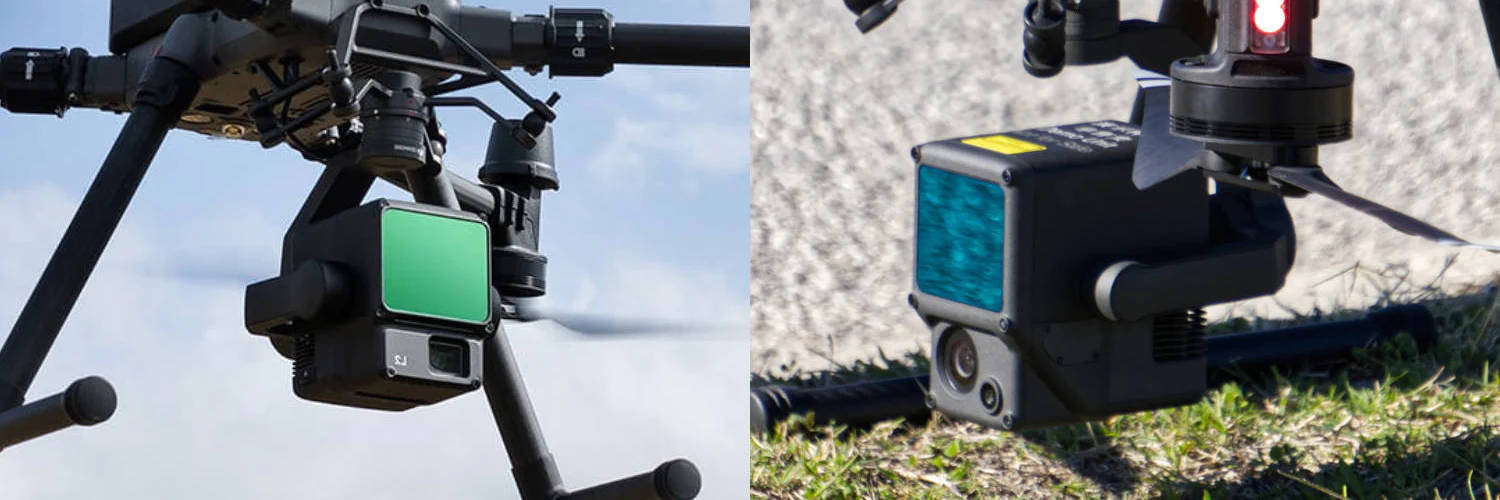
To ensure accuracy and therefore the ability to compare both payloads to each other, our team kept universal settings for both where possible.
This excludes the return mode, which went from dual return to penta return on the L2 and the IMU warm-up time, which is no longer applicable to the L2.
| Payload | Zenmuse L1 | Zenmuse L2 |
| Scan Mode | Repetitive | Repetitive |
| Return Mode | Dual Return | Penta Return |
| Sample Rate | 240KHz | 240KHz |
| Flight Speed | 6m/s | 6m/s (15m/s used in additional test) |
| Flight Height | 50m | 50m |
| Side Lap | 20% | 20% |
Vegetation penetration
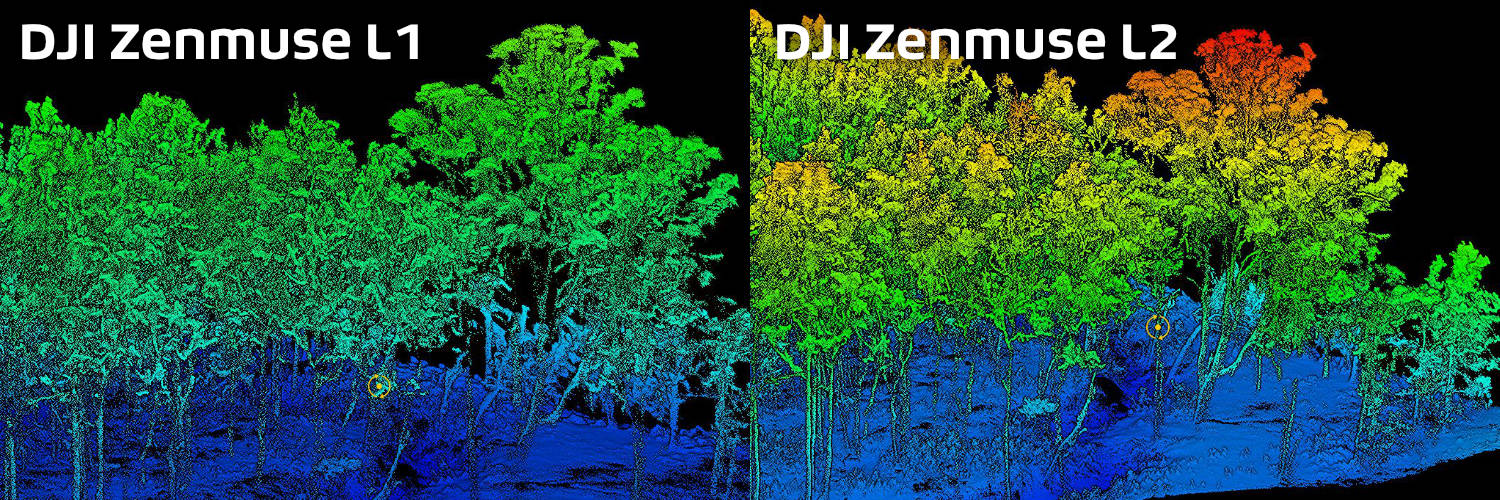
Vegetation penetration with L1 was acceptable, but the clarity of tree trunks, layers of the canopy, and floor-level features wasn't as clear as our team would've liked.
The precision on the L2 data is higher, with the point cloud having a higher density below the canopy and displaying finer detail, allowing for better and clearer quantification of the biomass and topography.
A higher number of returns on the L2 is also advantageous, painting an exact picture of the ground level beneath the vegetation.
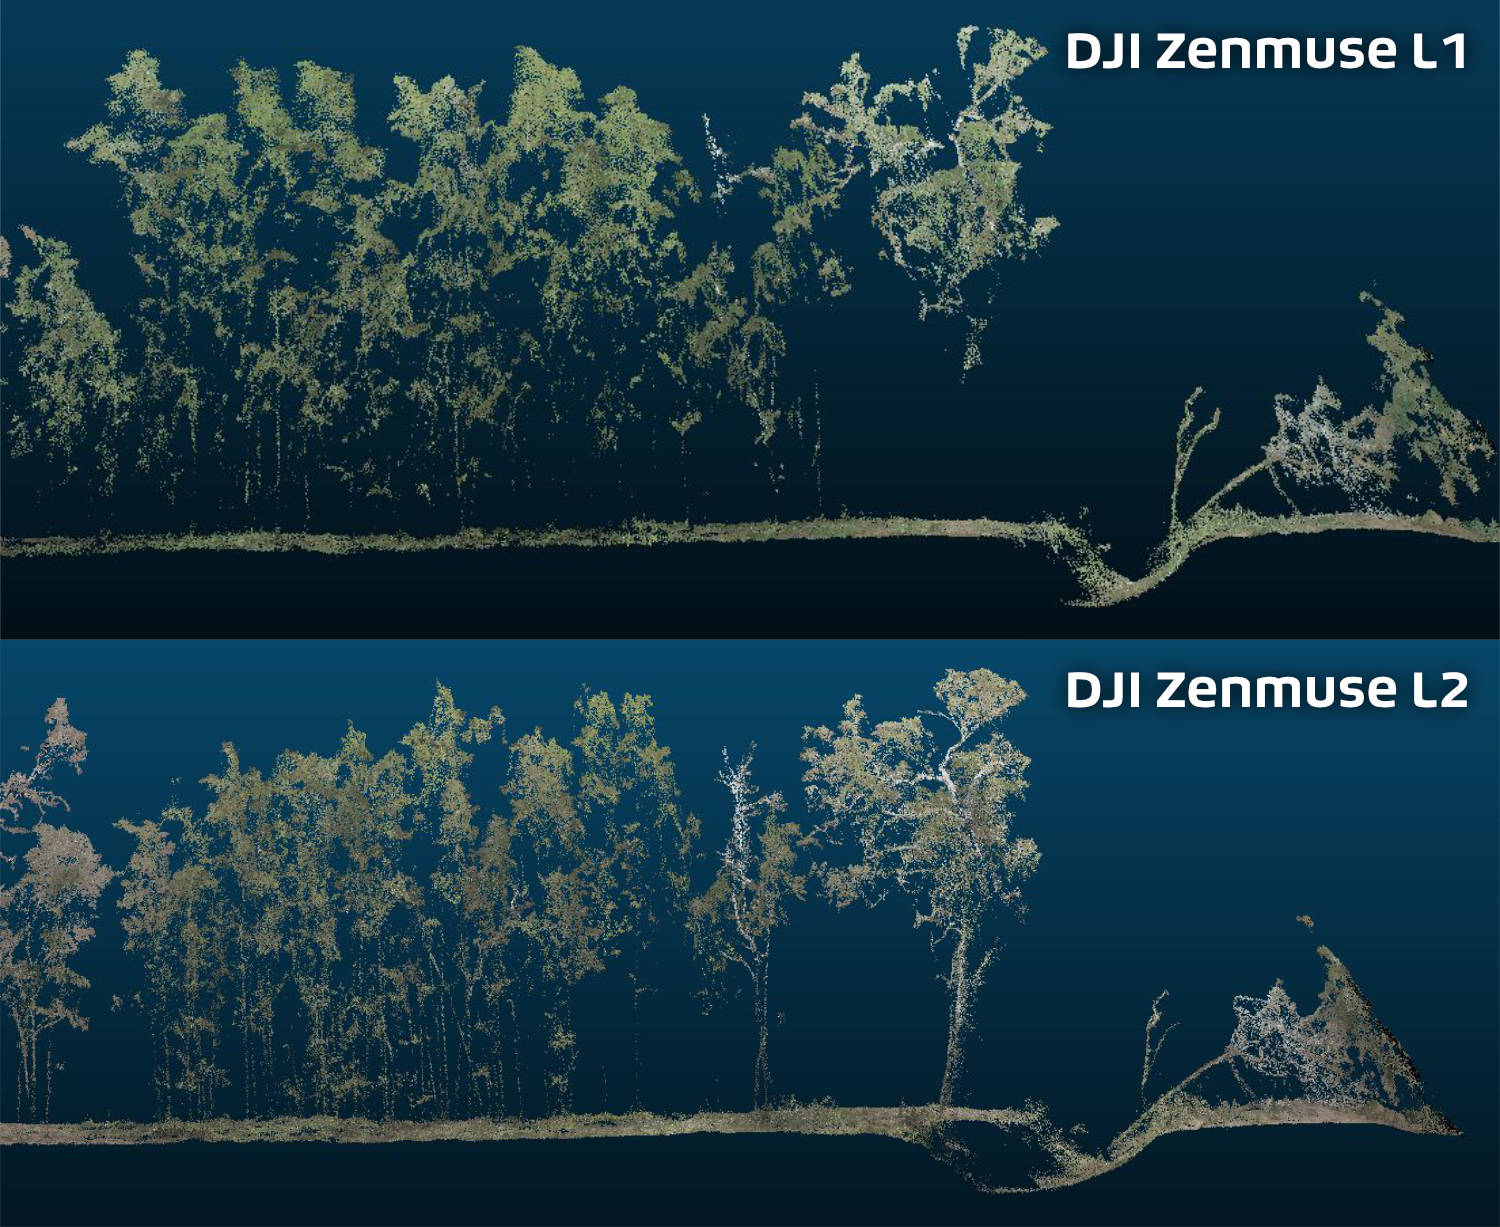
Our team found vegetation penetration to be improved on the L2 with very uniform point density across the entire cross-section shown above. The L1 at a ~1m wide strip clearly displayed visible gaps and holes in the cross-section, which is not present in the data from the L2.
Both tests were conducted at 50m AGL at 6m/s.
Returns
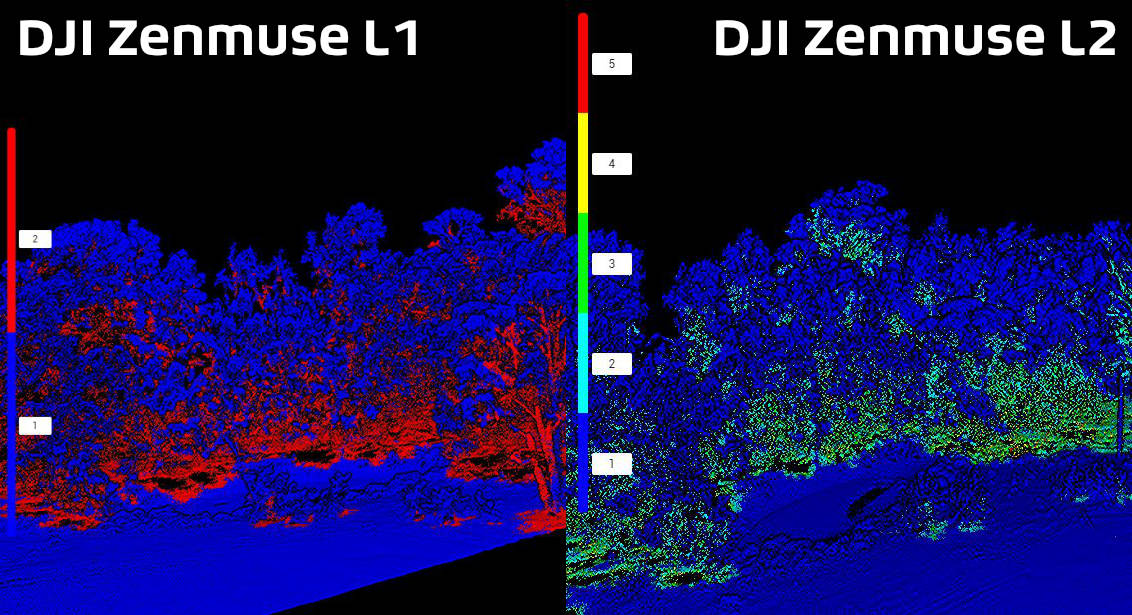
The L2, with its five returns provided our team with additional coverage at various levels of the vegetation coverage all the way to ground level. The L1 on the other hand was not able to provide all of this information as a result of only completing two returns over the area.
While in this example there were few returns visible for the fifth echo, it is a feature that the industry will be very excited about having the capability to quantify.
Colourisation
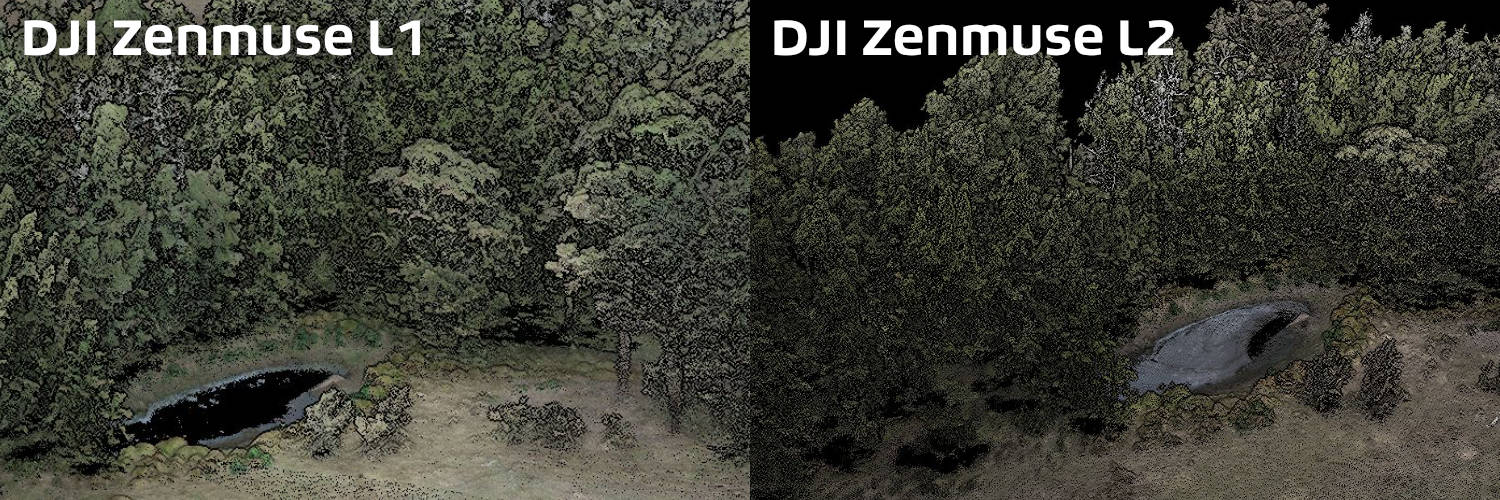
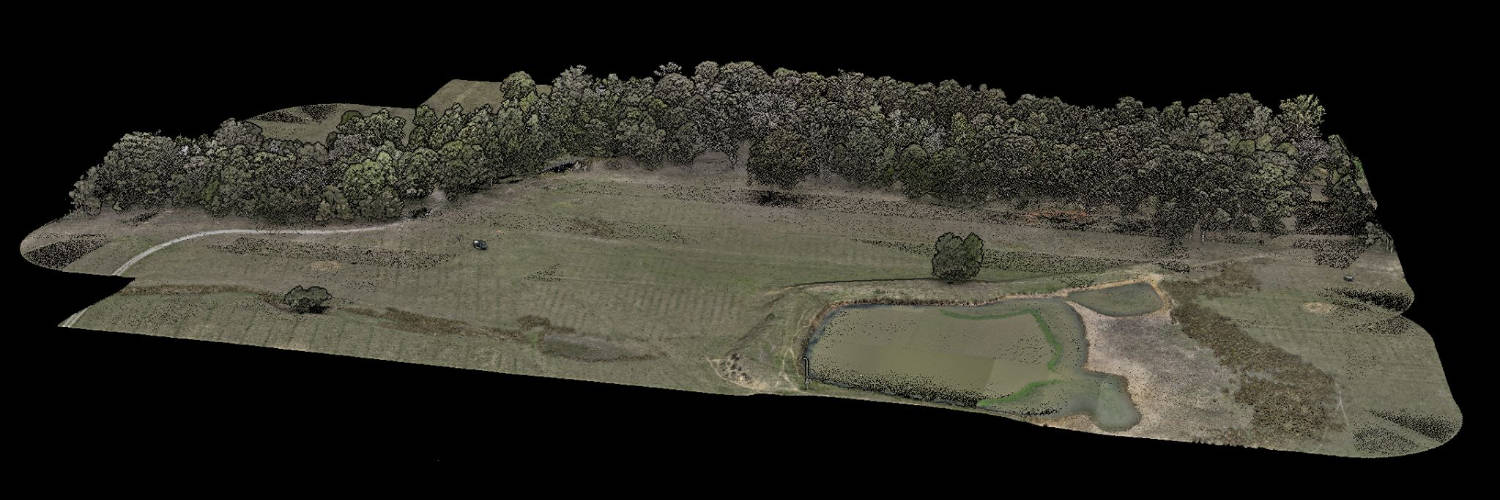
The Sphere Drones team found that the L2 has higher precision and is far superior to the L1 when it comes to the colourisation of the point cloud. The smoothness and clarity of the data, including rendering of the surface of the pond, is well defined and an improvement over the L1.
The L2 takes the L1's colourisation from being nice to have to be an accurate and worthy feature to use when revising point clouds.
Error data
The data was compared against six ground control points throughout the property and was captured using a Trimble R12 base station.
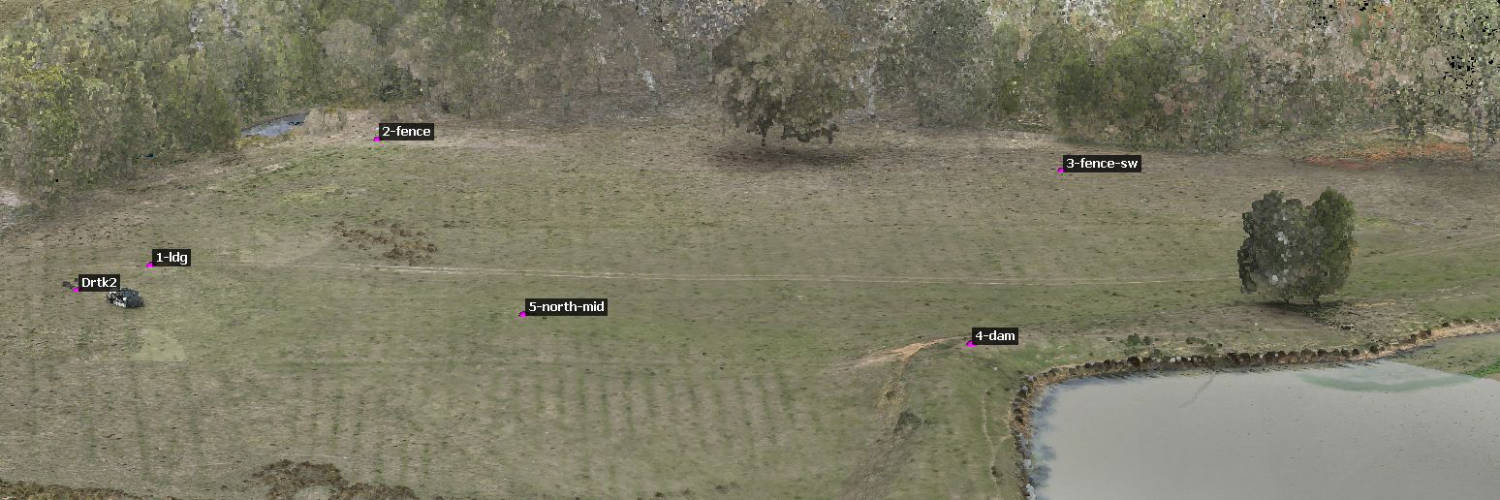
L1 vs L2 at 50m flying at 6m/s
L1 Check Point Error
| Parameters | Average Altitude Difference | Min Altitude Difference | Max Altitude Difference | Average Absolute Value of Altitude Difference | Root Mean Square | Standard Deviation |
|---|---|---|---|---|---|---|
| -0.091692 | -0.186136 | 0.013588 | 0.096221 | 0.109237 | 0.119663 |
L1 Error info
| ID | X/E | Y/N | Z/U | Reconstruction Altitude | Altitude Difference | Reflectivity |
|---|---|---|---|---|---|---|
| Drtk2 | 290004.673 | 6239640.204 | 75.354 | 75.367588 | 0.013588 | 68.090909 |
| 1-ldg | 290001.675 | 6239627.636 | 75.574 | 75.451981 | -0.122019 | 64.457557 |
| 2-fence | 290009.237 | 6239559.802 | 75.682 | 75.495864 | -0.186136 | 92.017341 |
| 3-fence-sw | 289895.248 | 6239532.422 | 76.705 | 76.626797 | -0.078203 | 74.581921 |
| 4-dam | 289875.98 | 6239615.336 | 79.261 | 79.168546 | -0.092454 | 108.083333 |
| 5-north-mid | 289939.444 | 6239622.926 | 75.923 | 75.838072 | -0.084928 | 69.177285 |
The DJI Terra processed data showed an RMS Z-accuracy of 10.9cm which with post processing and a PPK workflow could likely be further improved.
L2 Check Point Error
| Parameters | Average Altitude Difference | Min Altitude Difference | Max Altitude Difference | Average Absolute Value of Altitude Difference | Root Mean Square | Standard Deviation |
|---|---|---|---|---|---|---|
| -0.044028 | -0.142643 | 0.059995 | 0.064026 | 0.073567 | 0.080588 |
L2 Error info
| ID | X/E | Y/N | Z/U | Reconstruction Altitude | Altitude Difference | Reflectivity |
|---|---|---|---|---|---|---|
| Drtk2 | 290004.673 | 6239640.204 | 75.354 | 75.413995 | 0.059995 | 78.695266 |
| 1-ldg | 290001.675 | 6239627.636 | 75.574 | 75.515366 | -0.058634 | 77.292553 |
| 2-fence | 290009.237 | 6239559.802 | 75.682 | 75.539357 | -0.142643 | 81.434434 |
| 3-fence-sw | 289895.248 | 6239532.422 | 76.705 | 76.662958 | -0.042042 | 64.670588 |
| 4-dam | 289875.98 | 6239615.336 | 79.261 | 79.215438 | -0.045562 | 77.672222 |
| 5-north-mid | 289939.444 | 6239622.926 | 75.923 | 75.887718 | -0.035282 | 80.442308 |
The DJI Terra processed data showed an RMS Z-accuracy of 7.3cm which is an improvement over the L1.
L2 at 50m flying at 15m/s
Check Point Error
| Parameters | Average Altitude Difference | Min Altitude Difference | Max Altitude Difference | Average Absolute Value of Altitude Difference | Root Mean Square | Standard Deviation |
|---|---|---|---|---|---|---|
| -0.037739 | -0.124399 | 0.062959 | 0.058726 | 0.066973 | 0.073366 |
Error info
| ID | X/E | Y/N | Z/U | Reconstruction Altitude | Altitude Difference | Reflectivity |
|---|---|---|---|---|---|---|
| Drtk2 | 290004.673 | 6239640.204 | 75.354 | 75.416959 | 0.062959 | 80 |
| 1-ldg | 290001.675 | 6239627.636 | 75.574 | 75.522421 | -0.051579 | 77.92029 |
| 2-fence | 290009.237 | 6239559.802 | 75.682 | 75.557601 | -0.124399 | 76.960396 |
| 3-fence-sw | 289895.248 | 6239532.422 | 76.705 | 76.676678 | -0.028322 | 66.75 |
| 4-dam | 289875.98 | 6239615.336 | 79.261 | 79.204479 | -0.056521 | 78.25641 |
| 5-north-mid | 289939.444 | 6239622.926 | 75.923 | 75.894426 | -0.028574 | 79.494382 |
The L2 was able to be flown at up to 15m/s, improving the efficiency of the capture, while still maintaining 6-7cm RMS accuracy as achieved at 6m/s. PPK or processing using Terrascan may be able to further refine the data.
All data from DJI Terra v3.9.0
Benefits of the DJI Zenmuse L2
The L2 introduces a number of improvements over the L1 including being more accurate and precise with an RMS z-accuracy of 7.3cm compared to 10.9cm. The L2 also has improved vegetation penetration with the generated point clouds having a higher density below the canopy as well as showing finer details.
L2 can fly at 15m/s making data capture faster when compared with the L1, while still ensuring data quality. Zenmuse L2 can achieve an RMS z-accuracy of 6-7cm at 15m/s, in line with quality when flying at 6m/s with the L2.
Zenmuse L2 no longer requires an IMU warmup period allowing for quicker deployment and turnaround between flights. L1 requires 5-10 minutes for the IMU to warm-up.
Thanks to the combination of higher precision and an improved RGB camera, the L2 produces a more accurate colour rendition of scenes.
