


Event Overview
Date & Time
Thu. 09 April 2020 - Thu. 09 April 2020
2:00 pm - 3:00 pm AEST
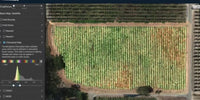
This webinar will provide insight into the importance of multispectral sensors and how to visualise MicaSense data with the free and open source software QGIS. We will cover what data a multispectral sensor captures and why it’s important. We will then have a brief look at the different sensors available and their primary uses before jumping into an interactive demo on visualising MicaSense multispectral data. We will look at creating False Color Composites, generating vegetation indices such as NDVI and NDRE and we will show you how to manipulate the data to generate effective and meaningful visualisations for crop/vegetation analysis.
Webinar Agenda
• Background on MicaSense
• What a Multispectral Sensor Captures and why this data is useful.
• Interactive demo of visualising Multispectral data in QGIS
About MicaSense
At MicaSense, we’re at the forefront of multispectral sensor development, and together with our customers, we’re pushing the boundaries on agricultural data analysis. We get the right tools into your hands so you can make the right call at the right time—with clear, actionable information to guide your decisions in the field.